

Jeromy Carrière
Nortel
Ottawa, ON
Canada K1Y 4H7
+1 613-763-6305
jayc@nortel.ca
Rick Kazman
Software Engineering Institute
Pittsburgh, PA
15213
+1 412-268-1588
rkazman@sei.cmu.edu
Keywords: Information visualization, World Wide Web, Information retrieval.Finding information located somewhere on the World-Wide Web is an error-prone and frustrating task. The WebQuery system offers a powerful new method for searching the Web based on connectivity and content. We do this by examining links among the nodes returned in a keyword-based query. We then rank the nodes, giving the highest rank to the most highly connected nodes. By doing so, we are finding "hot spots" on the Web that contain information germane to a user's query. WebQuery not only ranks and filters the results of a Web query, it also extends the result set beyond what the search engine retrieves, by finding "interesting" sites that are highly connected to those sites returned by the original query. Even with WebQuery filtering and ranking query results, the result sets can be enormous. So, we need to visualize the returned information. We explore several techniques for visualizing this information--including cone trees, 2D graphs, 3D graphs, lists, and bullseyes--and discuss the criteria for using each of the techniques.
The other popular technique for finding information on the WWW is to use one of the content-based search tools (Open Text, Lycos, Excite, Alta Vista, etc.). These search tools attempt to index the entire web via its content, where they define content to be the words in a page. Of course, they can never completely achieve this goal, since the Web is a constantly changing database. The search tools provide users with the ability to search the index, returning pointers--URLs--to pages that match the query words, to a greater or lesser degree.
The problem in querying, as with the Yellow-page services, is one of term choice, commonly called the vocabulary problem [6]. The vocabulary problem arises because there are many ways of expressing similar ideas using natural language.
If the user of the search tool or Yellow-page service does not form the query using the same terms that the author of the original page used, the desired pages will not be returned as a result of the query. For example, if a user is looking for weather maps, but the creators of those maps consistently call them "meteorological surveys", a search on the terms "weather map" will return no relevant pages, and will give no indication as to why the search was a failure. Or, it might return a small number of "hits" for the query, but not return many related (and relevant) pages, simply because those other pages did not contain the requested terms.
A different, but almost as daunting problem stems from the size of the WWW and the generous nature of a full-text search. Unless the user is clever about forming it, thousands of pages might be returned in response to an innocent query. In this case, the user will often give up browsing through the list of returned pages long before it has been exhausted, and frequently before the desired result has been found (even if it did exist among the returned pages).
These twin problems of precision (the percentage of relevant documents retrieved as compared to all documents retrieved) and recall (the percentage of relevant documents retrieved as compared to all relevant documents) are well known in the information retrieval literature. These problems are exacerbated in the WWW by its sheer magnitude: as of June 1996 there were an estimated 230,000 Web servers in existence, and the Web has been doubling in size every 3-6 months since mid 1993.1
Keyword-based searches--what every Web search tool provides--are increasingly unsatisfactory as the size of the Web grows. Put simply, a level of precision and recall that is satisfactory for searches of an institution's internal library database proves to be unwieldy for the huge scale of Web-based searches.
There is, however, one type of information that we can take advantage of to tame this size-induced complexity. It is based on the observation that people form communities on the Web and reference each other. In fact, it was the observation that people form human "webs" of information that prompted Tim Berners-Lee to propose the original World-Wide Web project to CERN management in 1989 [1]. This electronic web was meant to mirror the kinds of meetings in the hallway, coffee-room chats, chance associations, spontaneous group formation, and informal information exchange that is characteristic of human-human interaction. Berners-Lee's vision has been realized: Web pages form clusters, referencing each other.
We use this structural information and, in doing so, address the problems inherent in keyword-based searching of the WWW. What we are doing is extending searching from being simply content-based to becoming content and structure-based. Humans create interesting links to other humans, and to the information created by other humans. We created the WebQuery system to use this information in a way that eases the burden of finding pages located somewhere on the Web.
The remainder of this paper is organized into two parts. In the first part, we describe how the WebQuery system indexes and searches the WWW through both structure and content. We show how WebQuery allows us to hone searches and to alleviate the effects of the vocabulary problem. By relying on the human web as both a filter and an augmenter of text-based searches, we are able to find important sites quickly and dramatically. In the second part of the paper, we describe several techniques for visualizing the retrieved information, so that we can present combined structure and content to users. This allows us to capitalize on a human's innate pattern recognition abilities as a further guide to efficiently finding "interesting" WWW sites.
The MetaCrawler project embodies one effort to elevate the level of abstraction of searching by collating and verifying results from multiple search engines queried in parallel [12]. MOMSpider [5] is a spider constructed specifically to combat the problem of consistency and maintenance in evolving Web structures. It is the spider that we used for WebQuery.
WWW visualization is also a popular topic, but one approached from many different directions. Mukherjea and Foley's Navigational View Builder is a tool that allows hypermedia designers to create "efficient views of the underlying information space" [9]. Bray has generated dynamic VRML representations of the Open Text index database that displays sites based on their visibility (number of links into the site), their luminosity (number of links out of the site), their size, and so forth [2]. Lamm et al have developed a virtual reality system for visualization of site use based on geographic information [8]. See [3] for a useful and broad survey.
Finally, [11] presents a technique for extraction of structures (called localities) from the Web based on topology, textual similarity of documents and usage patterns. These structures are extracted using spreading activation based on a set of user-provided seed pages.
The WebQuery system is made up of several components. These components are grouped into two sub-systems, corresponding to two phases of system activity--pre-processing and run-time--as shown in Figure 1. The primary task of the preprocessing phase is the collection of connectivity information from the WWW, by way of a spider (a customized version of MOMSpider). This connectivity information simply specifies, for each node, the entire set of nodes it links to. This information is then post-processed to remove redundant information and uninteresting data (uninteresting from a structural viewpoint, such as links to non-HTML documents). Finally, a database is generated from the connectivity data for rapid retrieval in the run-time phase.
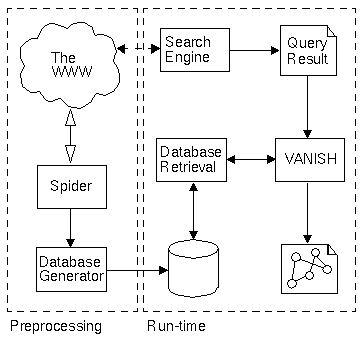
Figure 1. WebQuery system structure.
At run-time, a search engine (any available engine will do, such as one of those mentioned above) is used to perform a keyword- (or content-) based query. Although we could use our generated database for searching, we haven't collected any content information, such as titles or keywords, the way that commercial indexing systems do. Thus, a search using our database would be rather unenlightening. We are trying to augment existing search tools, not replace them.
A typical query is made up of a collection of keywords, possibly linked with boolean operators, isolating some particular subject of interest. An example of such a query is "hypertext AND indexing AND retrieval". The result of a query is a collection of URLs. For example, this query returned 426 URLs using Open Text's search engine. In many search engines these results are accompanied by a score, calculated by the search engine, that is intended to indicate the relevance of each node. In the WebQuery system, the resulting URLs and scores (if any) are fed into the VANISH [7] visualization prototyping tool for feedback to the user.
VANISH is a visualization tool that supports the easy integration of new semantic domains for visualization. VANISH was used to implement an algorithm that supplements the standard content-only searches with the structural information collected by our spider. The result of such a query is transformed into an information space suitable for visualization via a three step process.
The first step of this process is the expansion of the query result (we call this the hit set) into a complete neighbor set. The neighbor set is constructed by finding, for each node in the hit set, all nodes that it links to or that link to it. The database resulting from the spider's output is used to perform this lookup. The results of augmenting the hit set of returned nodes is actually a directed graph that may or may not have a spanning tree. Next, the connectivity of each node in the neighbor set is computed. The connectivity of a node is defined to be the node's total number of incoming and outgoing links. Finally, nodes are ranked in decreasing order of connectivity.
After the query has been post-processed in this fashion, an information space is constructed from the neighbor set, suitable for visualization. VANISH has the capability to visualize information spaces structured as both graphs and trees, with the restriction that any graph to be visualized has a spanning tree. Our post-processed queries may not satisfy this condition however. Thus, to satisfy this restriction in the context of the WebQuery system, we first partition the neighbor graph, according to the connectivity of the nodes, into some fixed number of subsets. Each resulting subset contains nodes of equal connectivity. Then, additional nodes are added to the neighbor graph to act as artificial parents to the nodes in each of the partitioned subsets. Finally, an artificial root is added to act as parent to the subset parents. In this way, any query result is forced to have a spanning tree, as depicted in Figure 2.
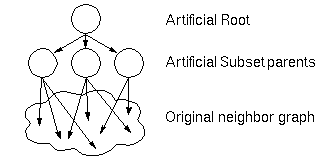
Figure 2. Structure of visualized information space.
The WebQuery system has been tested and validated using the WWW sites of the University of Waterloo as a (representative and typical) subset of the entire WWW. The spider collected all Web pages at the university--more than 200,000 URLs. Both the Open Text and Alta Vista search engines have been used to perform queries, which of course must be restricted to the uwaterloo.ca host domain.
http://www.cgl.uwaterloo.ca/~rnkazman/students.html
http://www.cgl.uwaterloo.ca/~rnkazman/others.html
http://www.cgl.uwaterloo.ca/members/member-list.html
http://math.uwaterloo.ca/CS_Dept/grad/Software.html
http://se.uwaterloo.ca/faculty.html
http://monet.uwaterloo.ca/lite/HomeImages/response1.0.html
http://etude.uwaterloo.ca/~mdesimon/presentations/index.html
http://math.uwaterloo.ca/CS_Dept/research.groups.html
http://math.uwaterloo.ca/CS_Dept/facstaff.html
http://www.lpaig.uwaterloo.ca/sgwoods/sgwoods-thesis.html
http://auk.uwaterloo.ca/aixgroup/aixusers.html
http://se.uwaterloo.ca/users.html
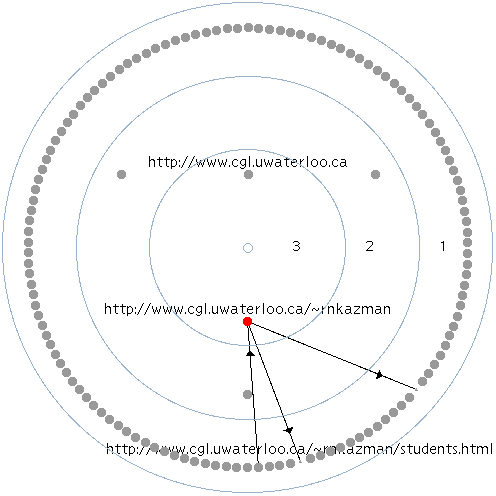
Figure 3. "Bullseye" view of "Rick Kazman" query.
The page that we thought (perhaps naïvely in retrospect) was most likely to occur in this set was Kazman's home page: "http://www.cgl.uwaterloo.ca/~rnkazman", Kazman's home page, did not appear in the hit set. In addition, there were a number of URLs that we could not identify and that we did not expect. The hit set was then processed using WebQuery and the resulting neighbor graph, consisting of some 270 nodes, was visualized using a "bullseye" technique, as shown in Figure 3.
This visualization shows three concentric circles, each containing nodes with equal connectivity (the partitioned subsets) and labelled with the connectivity value for that subset. The nodes with the highest connectivity are shown closest to the center, reinforcing the intuitive notion that the center of the bullseye is of greatest interest.
By default, no URLs are shown in the display. The two nodes in the innermost circle were interactively selected so that a user could determine their identities. Selecting a node causes its label--its URL--to appear. By doing so, we find that "http://www.cgl.uwaterloo.ca/~rnkazman" is one of these two most connected (and, by our hypothesis, most interesting) nodes. This node was not returned by the original query. It was, however, returned by WebQuery because of its high connectivity with the other pages that the query engine did return.
The bullseye visualization also shows other nodes in the visible neighbor set that are linked to by or link to this node. In Figure 3 one of these nodes has been selected to determine its identity. Further interaction with the visualization would allow the user to ascertain additional information of interest, or to cause a selected page to be retrieved by a Web client.
 (a) |
 (b) |
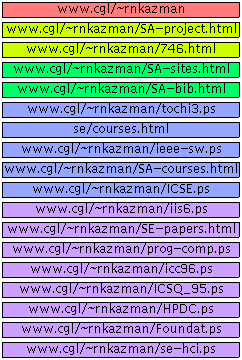
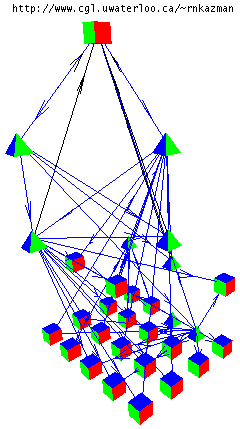
Figure 4. Visualization of "software engineering AND software architecture" query.
Figure 4 shows two views of the results. Figure 4(a) shows a sorted list view of the neighbor set (only the unique portions of the URLs are shown). All nodes with equal connectivity values are colored the same and grouped together in the list. Alternatively, the list could have been sorted by the score as returned by the search engine--a representation of the nodes returned from a content-based query that is closer to what the search engines themselves return. Figure 4(b) shows a three-dimensional visualization in which nodes are laid out in planes according to their connectivity values and arcs are drawn between structurally related (i.e., hyperlinked) nodes. In addition, nodes appearing in the original hit set are shown as tetrahedra, while other nodes--those added as a result of WebQuery augmenting the query results--are shown as cubes.
Interaction with this visualization allows the user to navigate in the 3D graph, either directly in the VANISH application or using an external VRML browser.
Finally, these two views of the results are connected: when nodes are selected in the list they are highlighted in the graph.
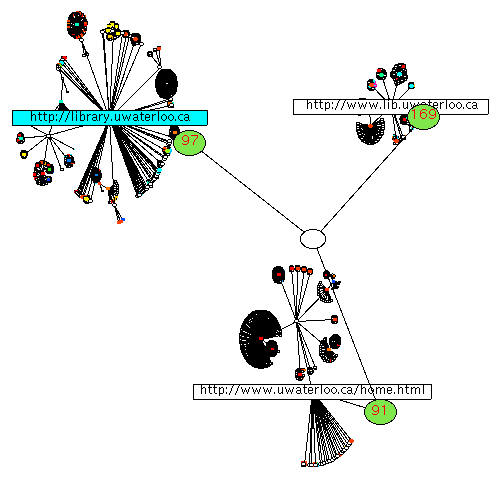
Figure 5. 2D cone tree visualization of "library" query.
Figure 5 shows a top view of a cone tree visualization [4] of the resulting information space. The cone tree is constructed from the neighbor graph by traversing the structure, depth first, beginning at the artificial root node and adding nodes to the tree in the order that they are visited. Given that we are attempting to visualize a graph as a tree, we are forced to insert place-holder nodes whenever already-visited nodes are encountered.
In this visualization, we see the artificial subset parent and root nodes, as described above: each artificial subset parent node (visualized here in green) is labelled by the connectivity value of its children.
Nodes from the hit set that appear in the tree are colored according to their score, as returned by the search engine, with red indicating highest score and blue indicating lowest. Nodes in the neighbor set that did not appear in the hit set from the original query are colored black. We not only visualize the connectivity of returned nodes, but also their original "score", as determined by the search engine. In this way, we do not throw away any information--we augment the information returned by the search engine.
In Figure 5 three nodes in the cone tree have been selected by the user:
http://www.lib.uwaterloo.ca
http://www.uwaterloo.ca/home.html
http://library.uwaterloo.ca
We see that the connectivity value of one of these artificial parents, 169, is the largest of any node in the tree (it has no siblings that would share its connectivity). This node represents the index of all electronic library resources at the University of Waterloo. This URL, surprisingly, was not returned by the search engine (it is colored black in the visualization), but is certainly the page one would wish to visit first when looking for library information.
The third URL selected--http://library.uwaterloo.ca--was found in the original hit set, but was the 33rd URL returned by the original search engine. Many users would have become discouraged browsing through 32 incorrect sites, and so would never have gotten to this useful one.
http://www.ahs.uwaterloo.ca/hfac/key1.html
http://www.ahs.uwaterloo.ca/hfac/programe.html
http://www.ahs.uwaterloo.ca/~wells/occinj.html
http://www.ahs.uwaterloo.ca/hfac/workshop.html
http://www.ahs.uwaterloo.ca/hfac/regise.html
http://www.adm.uwaterloo.ca/infoprov/chirorep.html
http://www.ahs.uwaterloo.ca/~cohs/descrip.html
Figure 6 shows the neighbor graph for the WebQuery-processed hit set. The nodes were laid out by a standard springs-and-weights graph layout algorithm. Here, the artificial parent nodes are shown in blue-green and labelled with the connectivity of their children, and the artificial root is explicitly labelled.
The single node linked to by the "6" artificial parent (indicating that it has a connectivity of six) has been selected. This node is colored red, indicating that it has the highest connectivity value of any node in the neighbor set. It happens to be the home page of the "28th Annual Conference of the Human Factors Association of Canada". By clicking on this node with the right mouse button, we view the page in our favorite WWW browser. We can see that this node is tightly coupled to the remainder of the neighbor set.
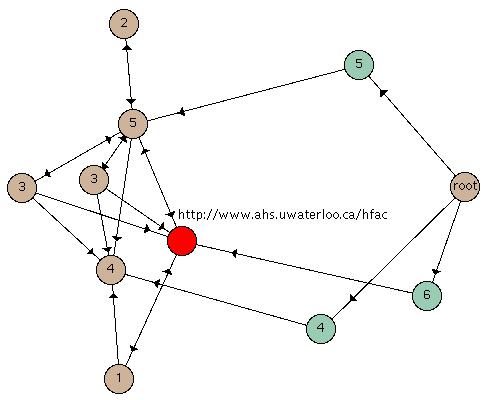
Figure 6. Graph visualization of "back pain" query.
The springs-and-weights algorithm employed here has the advantage that it tends to place highly connected nodes in the center of the viewing area, whereas nodes with low connectivity are placed toward the periphery. This is because, with this algorithm, nodes repel each other by default. Connections cause nodes to attract each other. Thus, a highly connected node gets placed at the center of its cohorts, because that is the place that minimizes the distance between the highly-connected node and its cohorts, while maximizing the distance between the cohorts themselves (which are less tightly coupled, or not coupled at all).
By considering link information, we achieve three desirable results.
The costs of WebQuery are twofold. The system needs connectivity information for all WWW sites to work, but this information is freely available to any organization with a spider. And it requires an extra processing step following a query. This processing step is not computationally expensive however. Hit nodes can be looked up in WebQuery's connectivity database in constant time. Once the node is found, its parents and children are retrieved, and the resulting connectivity is calculated.
When we wish to visualize large hit sets, we use cone trees. We use these because they make excellent use of screen real-estate, and have been shown effective in laying out large hierarchies (up to around 1,000 nodes). Although the cone trees shown here are 2D, cone trees may be also be computed for, and rendered in, 3D using VANISH. 3D mode has the effect of apparently placing some nodes closer to the user. This effect can be used to represent a node's importance to the user. Cone trees can also show the user some (but not all) of the relationships between the nodes in the result set.
A 3D graph layout is appropriate when there is a moderate number of nodes of equal connectivity. Because all relationships between nodes are shown, this technique is useful for ascertaining the context in which the nodes appear. Navigation through the visualization is effective in allowing the user to focus their attention on particular elements in the graph. However, because all relationships are shown, this technique breaks down with really large neighbor graphs.
Both bullseyes and springs-and-weights algorithms draw the user's attention to the highly ranked nodes. The bullseye algorithm shows the relationships between any selected node and its neighbors. The springs-and-weights algorithm shows all such relationships between all nodes in the neighbor set. However, springs-and-weights algorithms are computationally expensive, and work poorly for graphs greater than about 50 nodes.
Finally, we recognize that these layout possibilities serve different information seeking needs, and so multiple, connected, simultaneous views provide the information seeker with maximum flexibility and power. In addition, interaction with these views is a necessity to allow the user to explore, focus their attention, and to extract additional information about particular nodes in the visualization.
This visualization also comes at a cost. Graph layout and rendering are all substantially more computationally costly than simply arranging the hits in a list and leaving the chore of selecting from and filtering this list to the user.
First, the current implementation does not take advantage of content information returned from the search engine (beyond the scores provided) or meta-information available from the nodes themselves. Incorporation into the visualizations of information such as the size of nodes, the correlation between keywords and nodes, and so forth, would provide additional guidance to the WebQuery user.
Secondly, user studies are necessary to demonstrate the efficacy of the technique. Such studies would compare the effectiveness of WebQuery to that of content-only searches.
Finally, a mechanism for aggregation of nodes in the visualizations would provide users with a mechanism for hiding uninteresting detail. Aggregates could be computed automatically based on various attributes of the graph, including its structure and perhaps document similarity.
Just computing the most highly connected nodes in a query is insufficient however. We need to visually summarize these results and allow a user to interact with them. Thus, in WebQuery, we take advantage of a human's natural pattern-recognition ability, by visualizing the results in a number of different ways--bullseye, springs-and-weights, 2D cone tree projection, and 3D graph--each of which is tailored to a different kind of result set and information requirement. Interaction with the resulting visualizations allows the user to focus their attention directly on the results of the query in an immediate and compelling way.
[2] T. Bray, "Measuring the Web", in Proceedings of the Fifth World Wide Web Conference (Paris, May 1996).
[3] S. Card, "Visualizing Retrieved Information: A Survey", Special Report: Computer Graphics and Visualization in the Global Information Infrastructure, Computer Graphics and Applications, Vol. 16, No. 2, March 1996.
[4] J. Carrière, R. Kazman, "Interacting with Huge Hierarchies: Beyond Cone Trees", in Proceedings of IEEE Information Visualization '95, (Atlanta, GA), October 1995, pp. 74-81.
[5] R. Fielding, "Maintaining Distributed Hypertext Infostructures: Welcome to MOMspider's Web", in Proceedings of the First World Wide Web Conference (Geneva, May 1994).
[6] G. Furnas, T. Landauer, L. Gomez, S. Dumais, "The Vocabulary Problem in Human-Systems Communication", Communications of the ACM, 30(11), 1987, 964-971.
[7] R. Kazman, J. Carrière, "An Adaptable Software Architecture for Rapidly Creating Information Visualizations", in Proceedings of Graphics Interface '96 (Toronto, May 1996), 17-26.
[8] S. Lamm, D. Reed, W. Scullin, "Real-Time Geographic Visualization of World Wide Web Traffic", in Proceedings of the Fifth World Wide Web Conference (Paris, May 1996).
[9] S. Mukherjea, J. Foley, "Visualizing the World-Wide Web with the Navigational View Builder", in Proceedings of the Third World Wide Web Conference (Darmstadt, Germany, April 1995).
[10] B. Pinkerton, "Finding What People Want: Experiences with the WebCrawler", in Proceedings of the Second World Wide Web Conference (Chicago, October 1994).
[11] P. Pirolli, J. Pitkow, R, Rao, "Silk from a Sow's Ear: Extracting Usable Structures from the Web", in Proceedings of CHI'96 (Vancouver, April 1996).
[12] E. Selberg, O. Etzioni, "Multi-Service Search and Comparison Using the MetaCrawler", in Proceedings of the Fourth World Wide Web Conference (Boston, December 1995).